Financial Statement
1) Financial Statement: Summary - 2021~2025
(KRW 0.1 Billion)
| Items | End of 2021 | End of 2022 | End of 2023 | End of 2024 | End of 2025 |
|---|---|---|---|---|---|
| Current Assets | 45,983 | 48,883 | 52,084 | 58,917 | 70,976 |
| Quick Assets | 26,016 | 28,795 | 30,658 | 36,226 | 46,689 |
| Inventory | 18,184 | 19,016 | 21,195 | 22,508 | 24,130 |
| Assets Held for Sale | 1,557 | 869 | - | - | - |
| Right of Return Assets | 226 | 204 | 231 | 183 | 157 |
| Noncurrent Assets | 53,431 | 61,089 | 64,495 | 69,007 | 74,983 |
| Investment Assets | 3,471 | 3,203 | 2,814 | 3,421 | 5,708 |
| Tangible Assets | 46,394 | 52,353 | 56,033 | 59,332 | 62,217 |
| Other Noncurrent Assets | 3,566 | 5,533 | 5,648 | 6,254 | 7,058 |
| Total Assets | 99,414 | 109,972 | 116,579 | 127,924 | 145,959 |
| Current Liabilities | 22,347 | 25,251 | 29,004 | 30,568 | 38,195 |
| (Liabilities Held for Sales) | 69 | - | - | - | - |
| Noncurrent Liabilities | 8,356 | 7,786 | 7,271 | 7,197 | 9,791 |
| Total Liabilities | 30,703 | 33,037 | 36,275 | 37,765 | 47,986 |
| Total Equity | 68,711 | 76,935 | 80,303 | 90,159 | 97,973 |
| (Issued Equity) | 3,880 | 3,880 | 3,880 | 3,880 | 3,880 |
| Liabilities and Equity | 99,414 | 109,972 | 116,579 | 127,924 | 145,959 |
2) Income Statement - 2021~2025
(KRW 0.1 Billion)
| Items | 2021 | 2022 | 2023 | 2024 | 2025 |
|---|---|---|---|---|---|
| Sales | 96,750 | 94,066 | 88,924 | 102,941 | 113,145 |
| Cost of Sales | -71,271 | -71,419 | -71,731 | -83,349 | -90,371 |
| Gross Profit | 25,479 | 22,647 | 17,193 | 19,592 | 22,774 |
| SG&A | -10,610 | -10,589 | -10,588 | -12,242 | -13,641 |
| Operating Profit | 14,869 | 12,058 | 6,605 | 7,350 | 9,133 |
| Profit from Continuing Operations |
10,776 | 10,389 | 4,774 | 6,650 | 7,322 |
| Profit from Suspended Operations |
-1,622 | -454 | -269 | 382 | -12 |
| Net Income | 9,154 | 9,935 | 4,505 | 7,032 | 7,310 |
| Controlling Company Owner’s Share |
8,924 | 9,806 | 4,230 | 6,791 | 7,061 |
| Noncontrolling Interests |
230 | 129 | 275 | 241 | 249 |
※ Prepared by K-IFRS for fiscal years since 2010
Financial Highlights
-
Revenue
(KRW 0.1 Billion)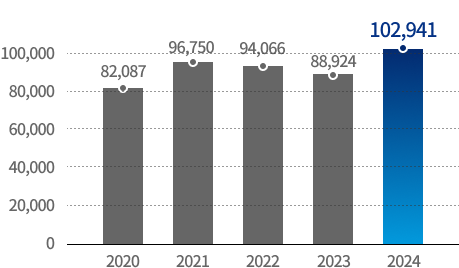
- Revenue(KRW 0.1 Billion) : 0, 20,000, 40,000, 60,000, 80,000, 100,000
- 2021 : 96,750
- 2022 : 94,066
- 2023 : 88,924
- 2024 : 102,941
- 2025 : 113,145
-
Operating Profit
(KRW 0.1 Billion)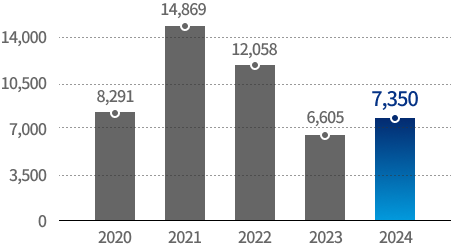
- Operating Profit(KRW 0.1 Billion) : 0, 3,500, 7,000, 10,500, 14,000
- 2021 : 14,869
- 2022 : 12,058
- 2023 : 6,605
- 2024 : 7,350
- 2025 : 9,133
-
Net Income
(KRW 0.1 Billion)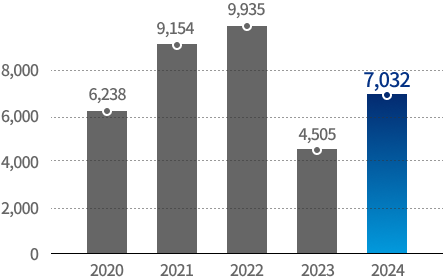
- Net Income(KRW 0.1 Billion) : 0, 2,000, 4,000, 6,000, 8,000, 10,000
- 2021 : 9,154
- 2022 : 9,935
- 2023 : 4,505
- 2024 : 7,032
- 2025 : 7,310
-
Assets
(KRW 0.1 Billion)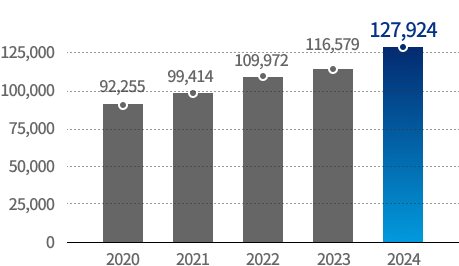
- Assets(KRW 0.1 Billion) : 0, 25,000, 50,000, 75,000, 100,000
- 2021 : 99,414
- 2022 : 109,972
- 2023 : 116,579
- 2024 : 127,924
- 2025 : 145,959
-
Debt Ratio
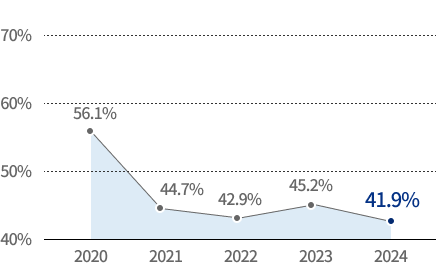
- Debt Ratio : 40%, 50%, 60%
- 2021 : 44.7%
- 2022 : 42.9%
- 2023 : 45.2%
- 2024 : 41.9%
- 2025 : 49.0%
-
Current Ratio
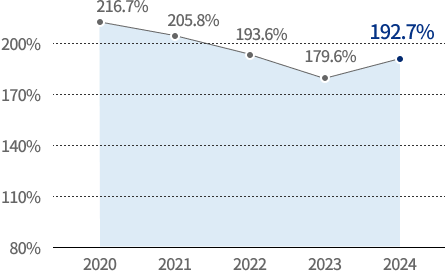
- Current Ratio : 80%, 110%, 140%, 170%, 200%
- 2021 : 205.8%
- 2022 : 193.6%
- 2023 : 179.6%
- 2024 : 192.7%
- 2025 : 185.8%